AQA GCSE Velocity time graphs and distance travelled(Physics)
Velocity time graphs and distance travelled
The area under a velocity time graph will show the distance travelled, or the displacement of an object.
For these types of questions the area under the graph will normally have a shape e.g triangle or rectangle.
Shape under the velocity time graph resembles a triangle
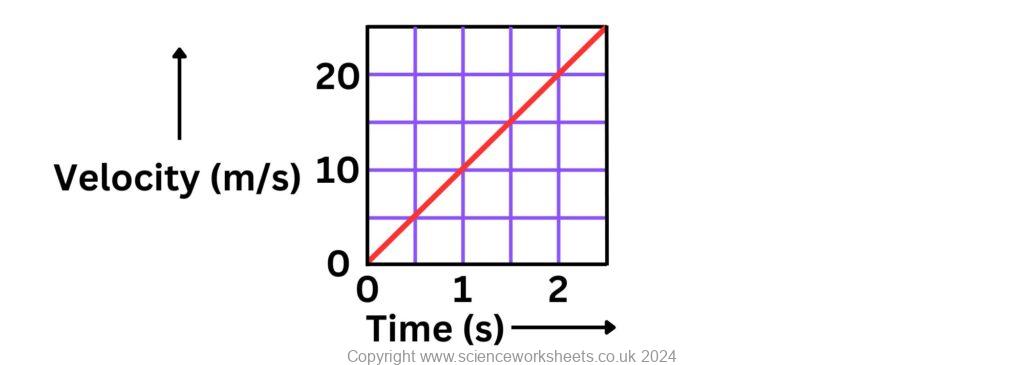
The area under the graph is shaded, in this case it is a triangle shape.
The area of this triangle, will give the distance travelled, or displacement.
Area of a triangle = 1/2 x base x height

Distance travelled (Area of the triangle) = 1/2 x 2.5 x 25 = 31.3m
It is also possible to work out the area of each square, then count the number of squares.
Distance travelled = area of each square x number of squares
This alternative method is slightly harder to use, so the triangle method was used.
Shape under the velocity time graph resembles a rectangle
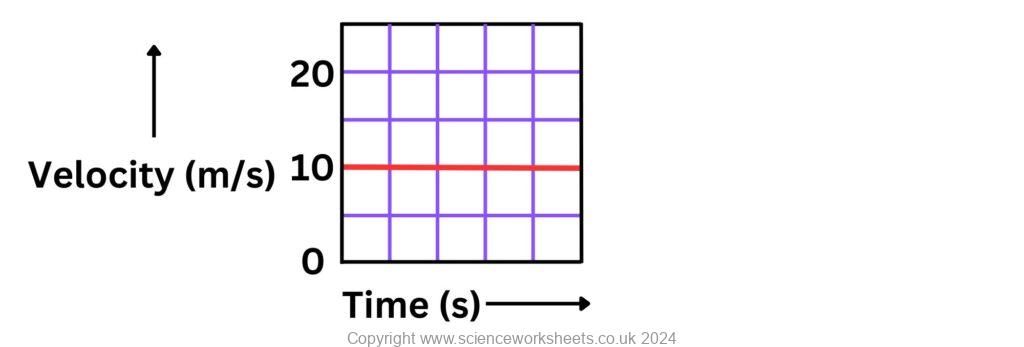
The area under the graph is shaded, in this case it is rectangle.

Distance travelled (area of rectangle) = length x width
Distance travelled = 10 x 2.5 = 25m
It is also possible to work out the area of each square, then multiply by the number of squares, but this method can be slightly more tricky.
Shape under the velocity time graph resembles a combination shape
In some cases there will be two or more shapes present. We will look at this example below
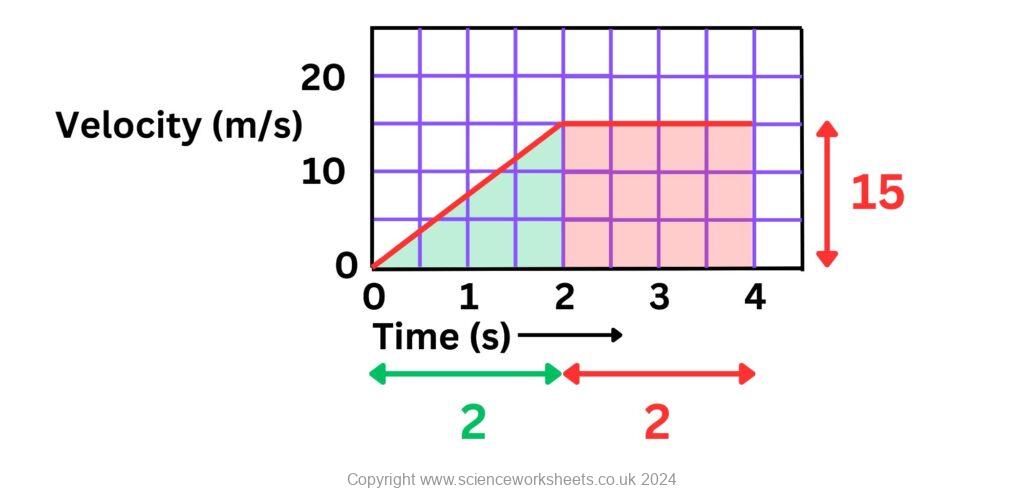
Lets work out the total distance travelled
The area under the line has been split into two different shapes a triangle and a rectangle.
Area of Rectangle = 15 x 2 = 30
Area of triangle = 1/2 x 15 x 2 = 15
Total area = 30 + 15 = 45
Total area under the graph = distance travelled
Total distance travelled = 45m.
Practice Question
1.What information can be found from the area under the graph.
2. Use the velocity time graph below to find the distance travelled in the first 8 seconds of the journey.

3.Use the velocity time graph below to find the distance travelled in the first 8 seconds of the journey.

4.Using your answers for questions 2 and 3, calculate the total distance travelled in both question 2 and 3.
Absorption and Emission of EM Radiation
JJ Thomson and Plum pudding model
Ernest Rutherford and the Nuclear Model
Niels Bohr changing the Nuclear Model
Discovering the Proton and Neutron
Measuring radiation from radioactivity
Radiation types and properties
Random nature of radioactive decay
Radioactive contamination or irradiation
Hazards of contamination and irradiation
Studies on the effects of radiation on humans
Different half lives of radioactive isotopes
Nuclear Fission Chain Reaction
Writing nuclear fission equations
Drawing ray diagrams for a concave lens
Drawing Ray Diagram to produce a virtual image for a convex lens
Drawing ray diagram to produce a real image for a convex lens.
Specular and Diffuse Reflection
Seeing Coloured Objects Part 2
Viewing objects through coloured filters
Transparent, Translucent and Opaque