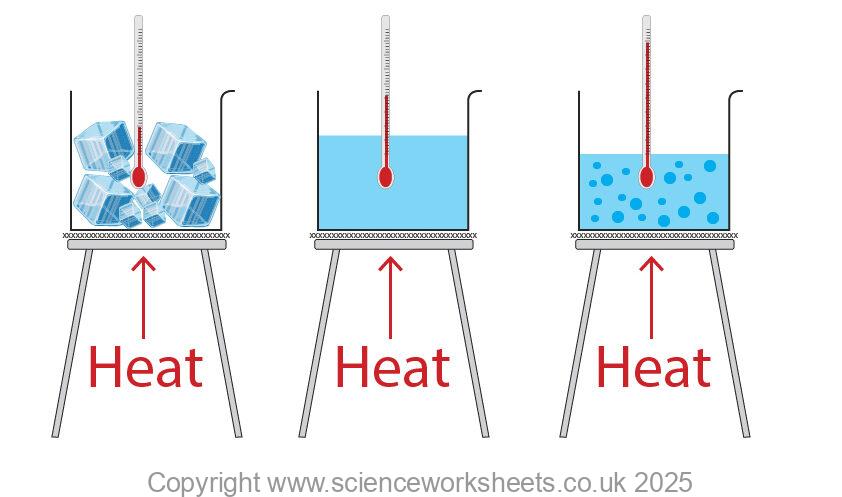
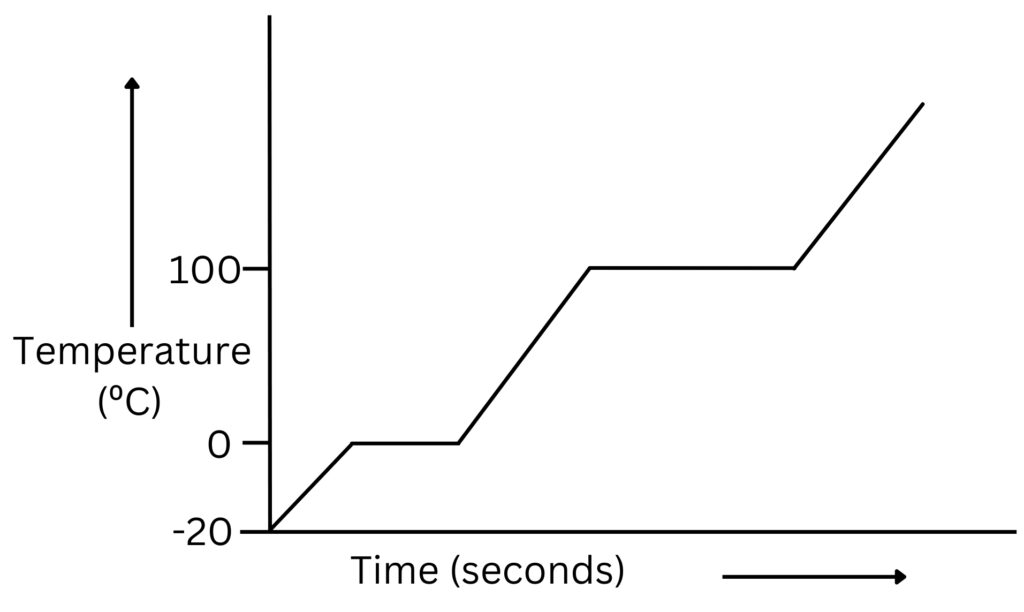
Solid to Liquid transition
When the solid ice is being heated its temperature increases because the energy supplied is being used to increase the temperature of the substance.
Once melting point of ice is reached, even though energy is supplied, the temperature does not increase during melting. You can see that at 0ºC, the graph is horizontal for melting.
The energy supplied is being transferred to the internal energy of the particles. As the particles gain internal energy, they vibrate more and the weak intermolecular forces between particles breaks as ice melts to form liquid water.
Liquid to Vapour transition
Once melting is complete and liquid water is formed, its temperature increases as heat energy is supplied until the boiling point is reached.
During boiling, heat energy is supplied continuously, the temperature will not change as the energy supplied is used to increase the internal energy of particles, so they move faster and the weak intermolecular forces between particles break as the liquid boils to form a vapour.
Cooling Curve
If a vapour is cooled and the temperature recorded over time, then the data can be used to draw a cooling curve.
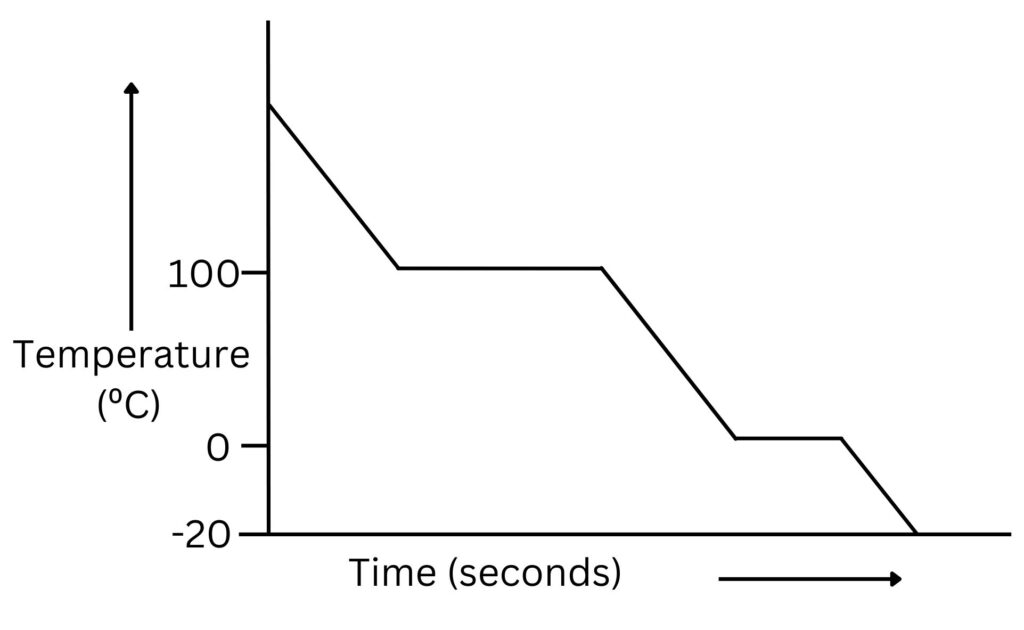
As the vapour is cooled, the temperature decreases until the boiling point, or condensation point is reached.
At the boiling or condensing point as energy is transferred away from the substance the temperature stays constant, but the internal energy of the particles decreases, so the particles move slower, intermolecular forces form between particles as the vapour condenses to form a liquid.
Once the liquid has formed, as liquid is cooled, temperature decreases until the freezing point or melting point is reached.
During freezing, as energy is transferred away from the substance, temperature stays constant, but internal energy of the particles decreases so they move more slowly, forming intermolecular forces between particles as the liquid freezes to form a solid.
Once solid is formed, cooling will cause the temperature to decrease.