AQA GCSE Velocity time graphs calculating acceleration(Physics)
Velocity time graphs and acceleration
Acceleration is defined as the rate of change of velocity.
A velocity time graph will show us how the velocity of an object changes over time.
The gradient (steepness of the line) will indicate the acceleration.
Calculating acceleration for straight line velocity time graphs
Using the data in the table, plot a velocity-time graph.
| Velocity (m/s) | Time (s) |
|---|---|
| 0 | 0 |
| 10 | 1 |
| 20 | 2 |
| 30 | 3 |
| 40 | 4 |
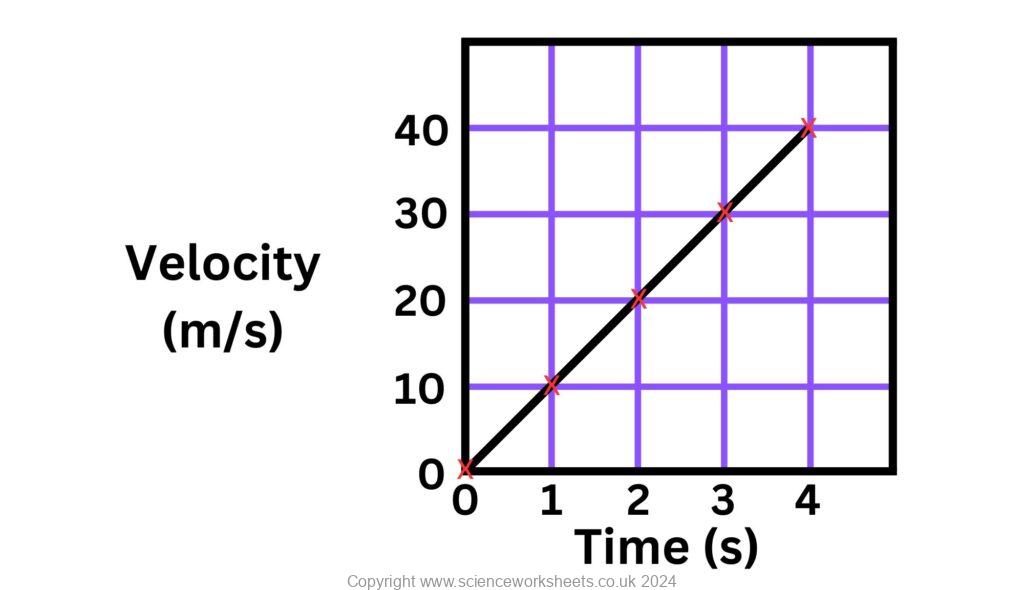
To calculate the acceleration, we need to make a triangle around the straight line.
Acceleration = change in velocity/time
We need to measure the change in velocity and the time period as shown in the grid below

Change in velocity = 20m/s
Time period = 2 seconds
Acceleration = 20/2 = 10m/s2
As the line is straight, gradient is constant, so accleration is constant or uniform.
Calculating acceleration for curved line velocity time graphs
Gradient of a velocity time graph is acceleration. If the line is curved, then gradient is changing, so acceleration is changing.
The data below was used to plot the following velocity time graph
| Velocity (m/s) | Time (s) |
|---|---|
| 0 | 0 |
| 30 | 1 |
| 37 | 2 |
| 39 | 3 |
| 40 | 4 |
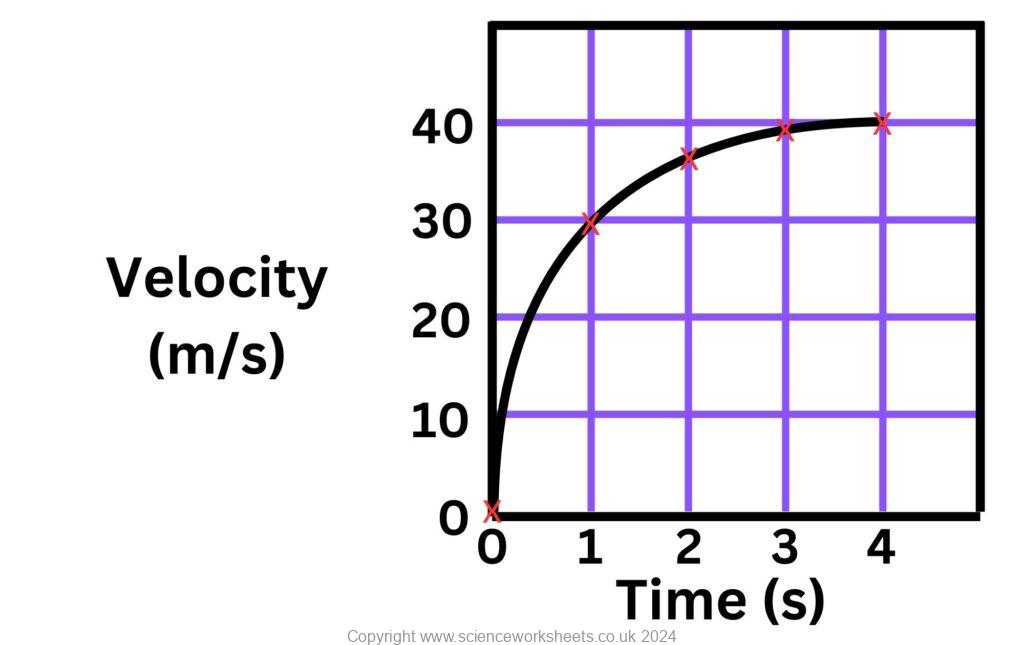
To calculate the acceleration, we need to measure the gradient. However, the gradient constantly changes with time in the graph above. So, in this case, we will measure the gradient at approx 1.5 seconds.

Acceleration = Change in velocity/time
Change in velocity = 10m/s
Time period = 1.6 seconds
Acceleration = 10/1.6 = 6.3m/s2
Ideally, you want to make the triangle as big as possible, but try to align it to easy to read points. In the above example I aligned it to the 30 and 40m/s velocity lines. It was not possible to do the same for the time period in this case
Practice Questions
1. Given two points on a velocity-time graph, how would you calculate the slope to find acceleration?
2. What does a curved line on a velocity-time graph indicate about acceleration?
3. Use the following data to draw a velocity time graph and then calculate the acceleration.
| Velocity (m/s) | Time (s) |
|---|---|
| 0 | 0 |
| 20 | 1 |
| 40 | 2 |
| 60 | 3 |
| 80 | 4 |
4. Use the following data to draw a velocity time graph and then calculate the gradient at 4.5 seconds.
| Velocity (m/s) | Time (s) |
|---|---|
| 0 | 0 |
| 4 | 1 |
| 10 | 2 |
| 25 | 3 |
| 75 | 4 |
| 150 | 5 |
| 400 | 6 |
Absorption and Emission of EM Radiation
JJ Thomson and Plum pudding model
Ernest Rutherford and the Nuclear Model
Niels Bohr changing the Nuclear Model
Discovering the Proton and Neutron
Measuring radiation from radioactivity
Radiation types and properties
Random nature of radioactive decay
Radioactive contamination or irradiation
Hazards of contamination and irradiation
Studies on the effects of radiation on humans
Different half lives of radioactive isotopes
Nuclear Fission Chain Reaction
Writing nuclear fission equations
Drawing ray diagrams for a concave lens
Drawing Ray Diagram to produce a virtual image for a convex lens
Drawing ray diagram to produce a real image for a convex lens.
Specular and Diffuse Reflection
Seeing Coloured Objects Part 2
Viewing objects through coloured filters
Transparent, Translucent and Opaque