Distance time graphs
A distance time graph is used to show the journey of an object over time.
Distance(m) | Time (seconds) |
---|---|
0 | 0 |
10 | 1 |
20 | 2 |
30 | 3 |
The data in the table above have been used to plot the distance time graph below.
Characteristics of distance time graphs
Calculate the Speed using a distance time graph
Speed = distance/time
The gradient of a distance time graph will give us the speed of the object.
We will use the following graph to show you how to calculate the speed:
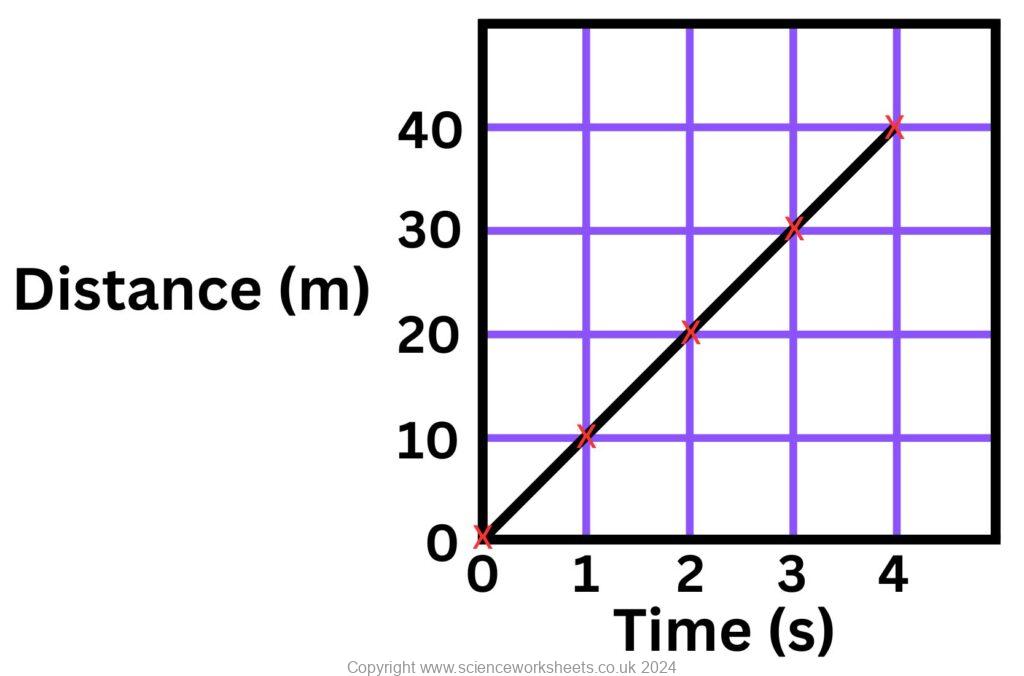
First draw a triangle and use the axes to measure the lengths of the sides.
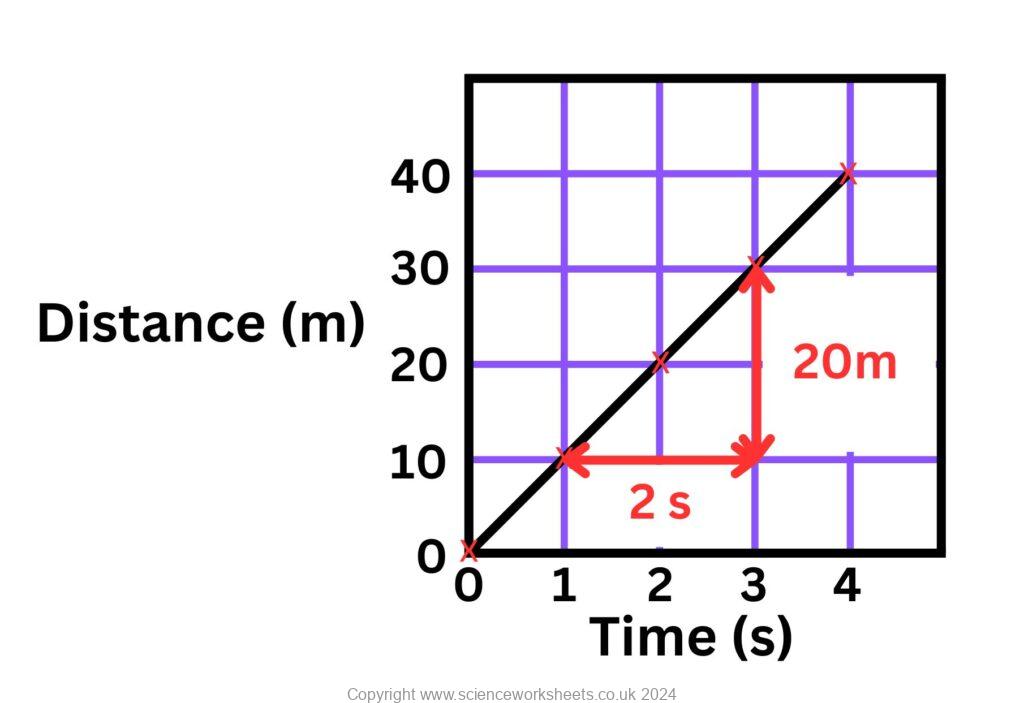
Gradient = Speed,
Gradient = Change in Y axis/Change in X axis
The Y axis (distance) is 30m-10m which is 20m
The X axis (time) is 3 seconds -1 second = 2 seconds
Speed = distance/time
Speed = 20m/2s = 10m/s
As the line is a straight line, the speed is constant
Fast and slow objects.
In the distance time graph below:
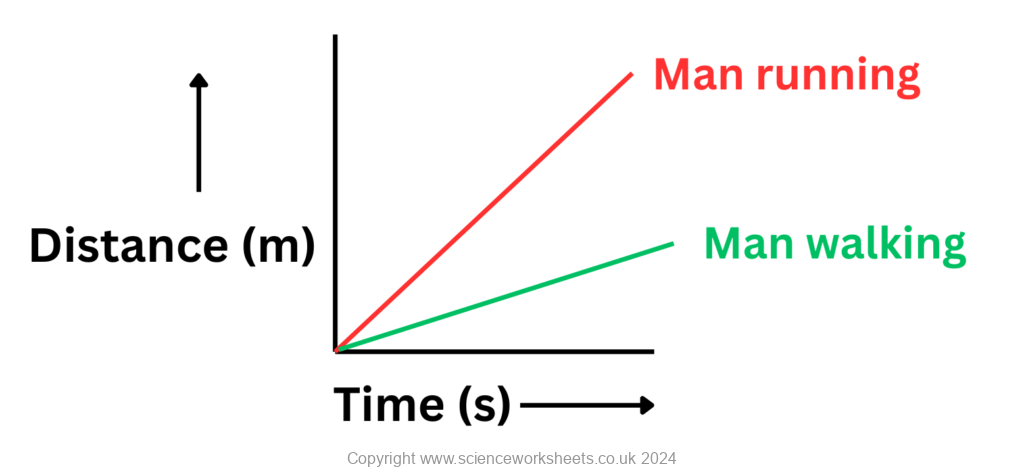
The green line for the man walking is less steep, so it has a small gradient and is moving more slowly
The red line for the man running is more steep, it has a bigger gradient and is moving faster.
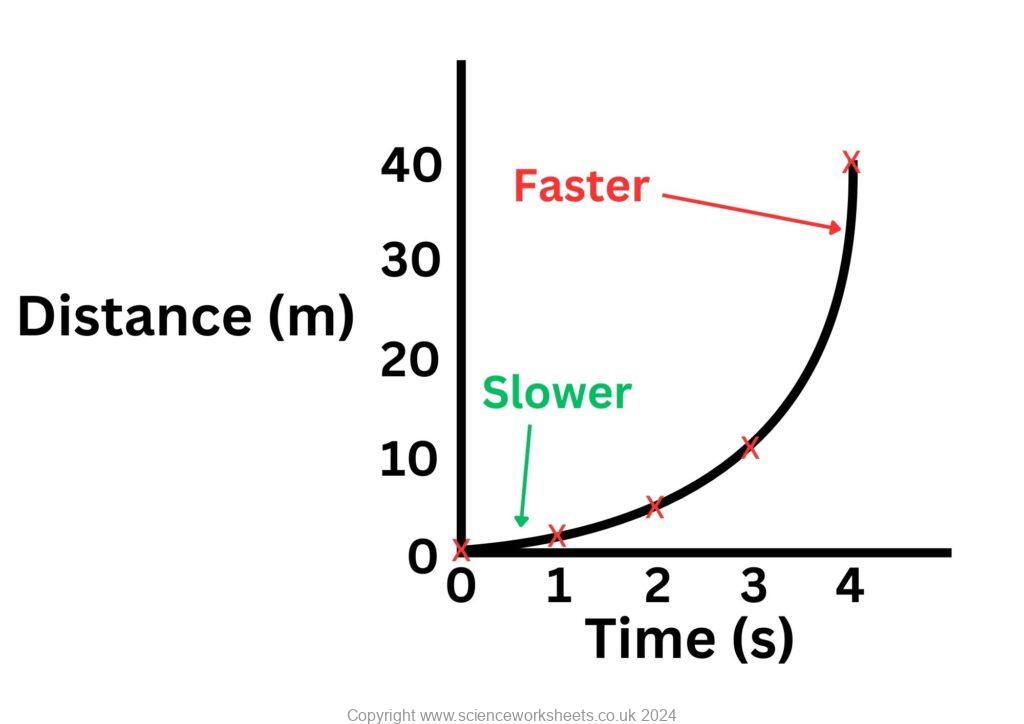
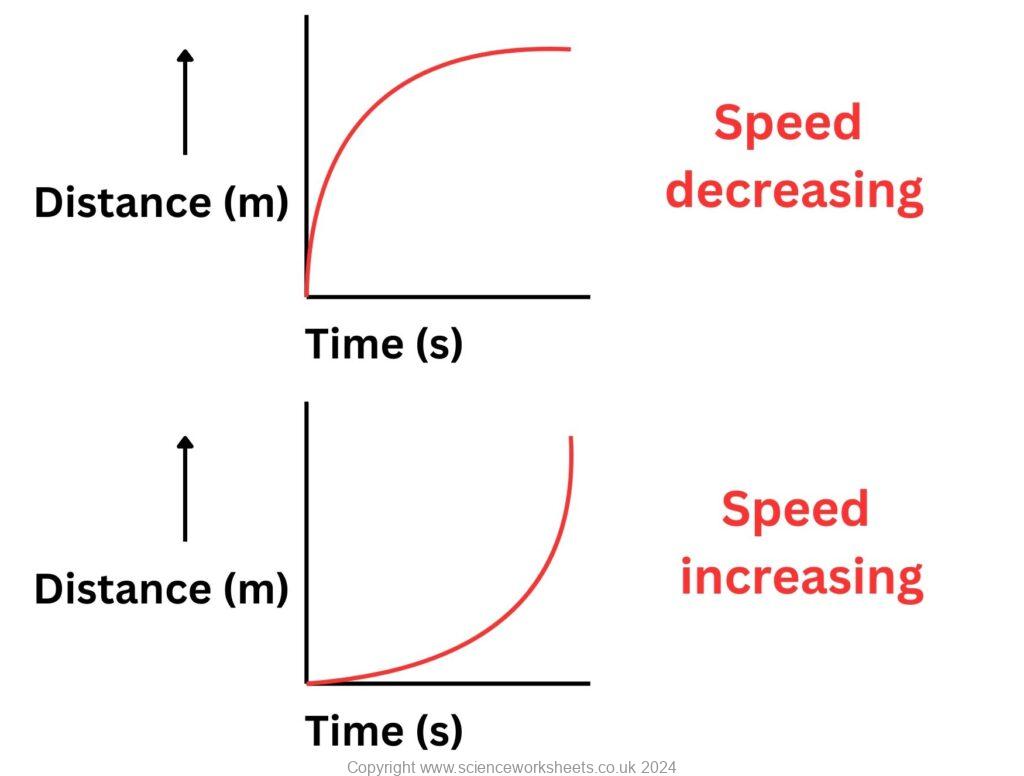
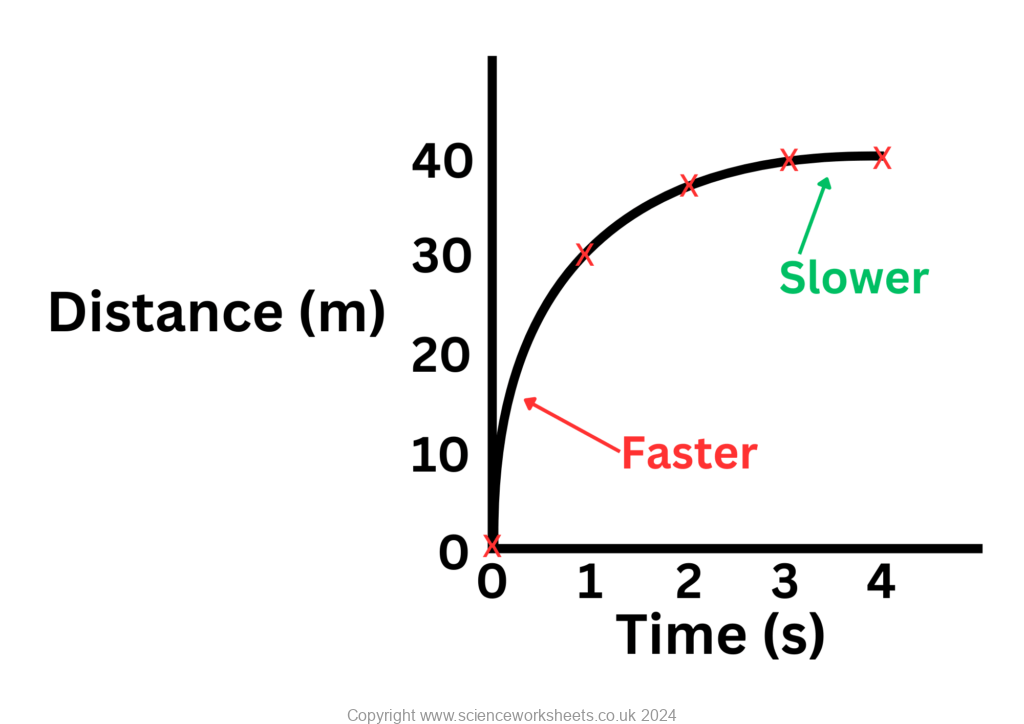
Acceleration and distance-time graphs
In the following graph, as time increases the gradient is decreasing, so the speed is decreasing. This means that the object has a negative acceleration or a deceleration.
The next graph wil show that as time increases, the gradient is increasing, so speed is increasing. This means that the object is accelerating.
Practice Questions
1.How can you find the speed of an object using a distance time graph
2. Analyse the distance time graph below and answer the following questions.
A car was driven a short distance then stopped for a brief period, before driving for a further distance to complete its journey. Use the distance time graph above to answer the following questions
2a. How far did the car travel in the first 2 seconds
2b. How long was the car stationary for
2c. During which time period was the car moving at the fastest speed?
2d. Calculate the speed of the car between 0 to 2 seconds
2e. Calculate the speed of the car between 7 to 13 seconds.
Absorption and Emission of EM Radiation
JJ Thomson and Plum pudding model
Ernest Rutherford and the Nuclear Model
Niels Bohr changing the Nuclear Model
Discovering the Proton and Neutron
Measuring radiation from radioactivity
Radiation types and properties
Random nature of radioactive decay
Radioactive contamination or irradiation
Hazards of contamination and irradiation
Studies on the effects of radiation on humans
Different half lives of radioactive isotopes
Nuclear Fission Chain Reaction
Writing nuclear fission equations
Accordion Content
Accordion Content