AQA GCSE Velocity time graphs and acceleration curved lines(Physics)
Velocity time graphs and acceleration
Acceleration is defined as the rate of change of velocity.
A velocity time graph will show us how the velocity of an object changes over time.
The gradient (steepness of the line) will indicate the acceleration.
Curved line velocity time graphs

In the velocity time graph above, the gradient is a curved line, so the acceleration is constantly changing.
As time increases, the gradient decreases (line less steep), this means that the acceleration will decrease.
Once the line is horizontal at the end of the graph, the acceleration is zero.
When the acceleration is zero, the velocity is constant!
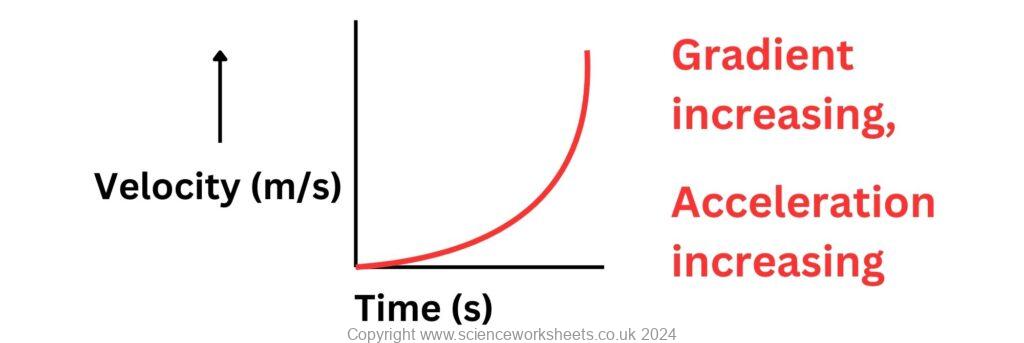
In the velocity time graph above the gradient is increasing, because the line becomes steeper. This means that acceleration is increasing, so the velocity will keep on increasing!
Practice Questions
1.A car’s velocity-time graph shows a curve that starts at zero velocity and increases non-linearly over time, eventually reaching a uniform velocity. Sketch a velocity time graph to show this motion.
2. If the curve on a velocity-time graph becomes steeper over time, how would you describe the change in acceleration?
3. If a curved velocity-time graph crosses the time axis, what does this indicate about the motion of the object?
Absorption and Emission of EM Radiation
JJ Thomson and Plum pudding model
Ernest Rutherford and the Nuclear Model
Niels Bohr changing the Nuclear Model
Discovering the Proton and Neutron
Measuring radiation from radioactivity
Radiation types and properties
Random nature of radioactive decay
Radioactive contamination or irradiation
Hazards of contamination and irradiation
Studies on the effects of radiation on humans
Different half lives of radioactive isotopes
Nuclear Fission Chain Reaction
Writing nuclear fission equations
Drawing ray diagrams for a concave lens
Drawing Ray Diagram to produce a virtual image for a convex lens
Drawing ray diagram to produce a real image for a convex lens.
Specular and Diffuse Reflection
Seeing Coloured Objects Part 2
Viewing objects through coloured filters
Transparent, Translucent and Opaque