AQA GCSE Using Force-extension graphs(Physics)
Using Force-extension graphs
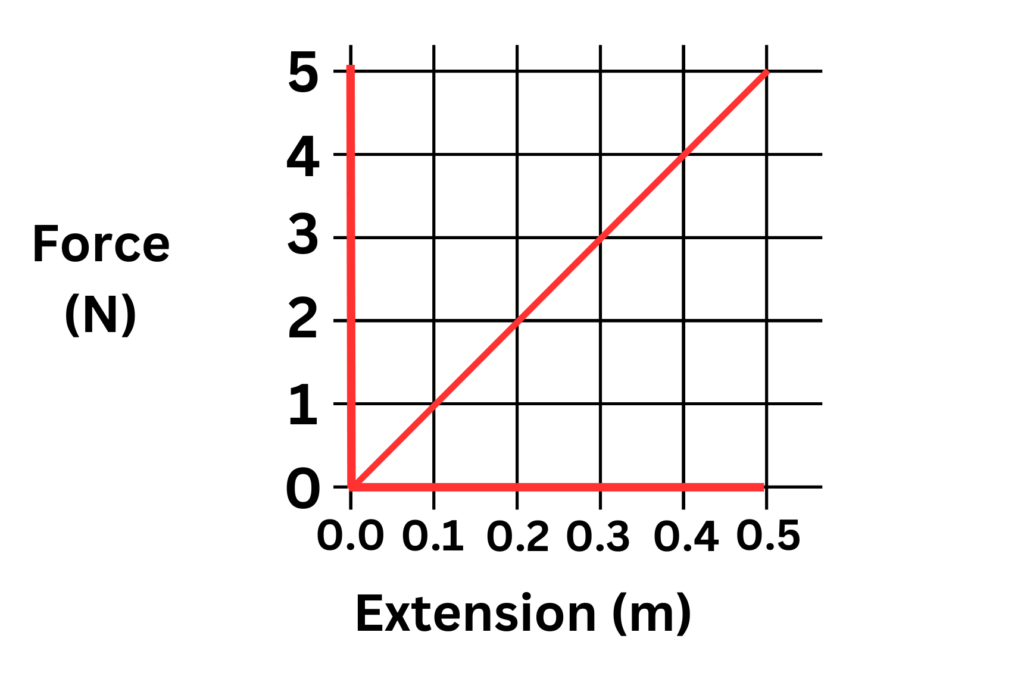
A force extension graph show how the extension of a material is changed when a force is applied to it. So, if weights are added to a spring, we can record the new length, calculate the extension and plot this as a graph

To find the extension, we subtract the two lengths. As weights were added to the spring, the following data was collected:
| Weight added, Force (N) | Original Length of spring(m) | New Length of spring(m) | Extension(m) |
|---|---|---|---|
| 0 | 0.05 | 0.15 | 0.10 |
| 1 | 0.05 | 0.25 | 0.20 |
| 2 | 0.05 | 0.35 | 0.30 |
| 3 | 0.05 | 0.45 | 0.40 |
| 4 | 0.05 | 0.55 | 0.50 |
| 5 | 0.05 | 0.65 | 0.60 |
A graph of Force(weight added) against extension is then plotted:

Gradient of the Force-Extension graph.
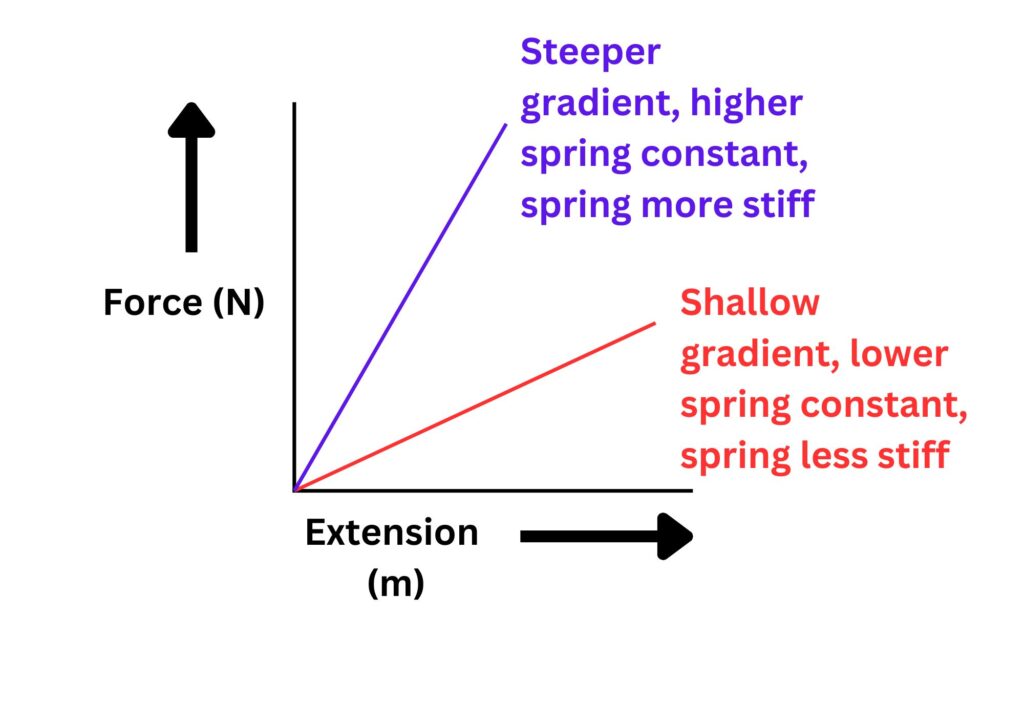
The gradient of the force extension graph will give the spring constant.
The spring constant is a measure of the stiffness of the spring. So, the steeper the gradient, the stiffer the spring because the spring constant will be larger.

Calculating Gradient or spring constant from graph.
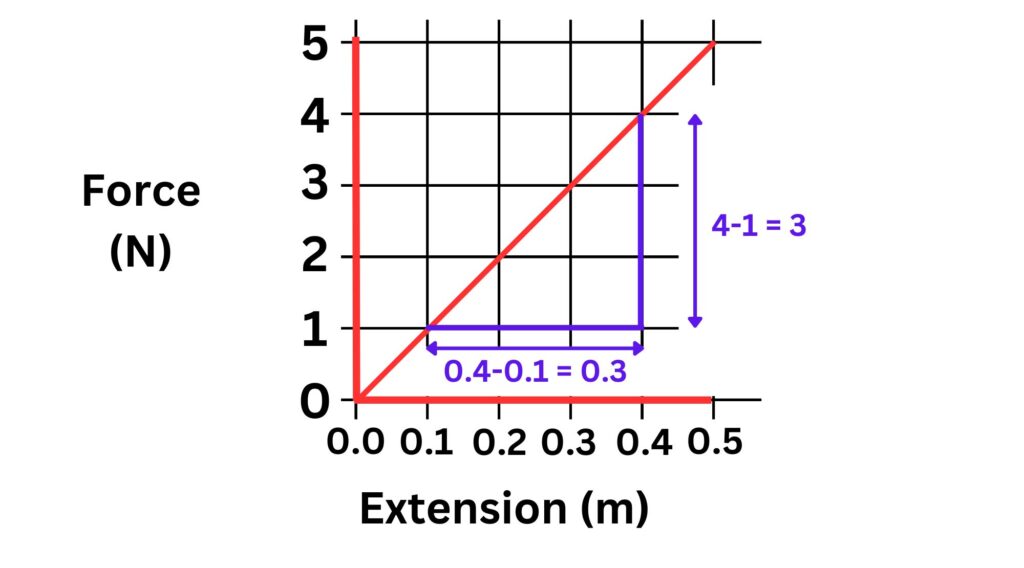
Using the graph above plotted on graph paper, we need to draw two lines, one vertical and one horizontal to form a triangle. Then calculate the length of these lines as shown in the diagram below:

Now gradient is calculated by dividing the change in force by the change in extension
Gradient (Spring constant) = 3N/0.3m = 10N/m
Practice Questions
1.What two pieces of information can be obtained from a Force extension graph
2. How can we use a force extension graph to obtain the spring constant for an elastic material?
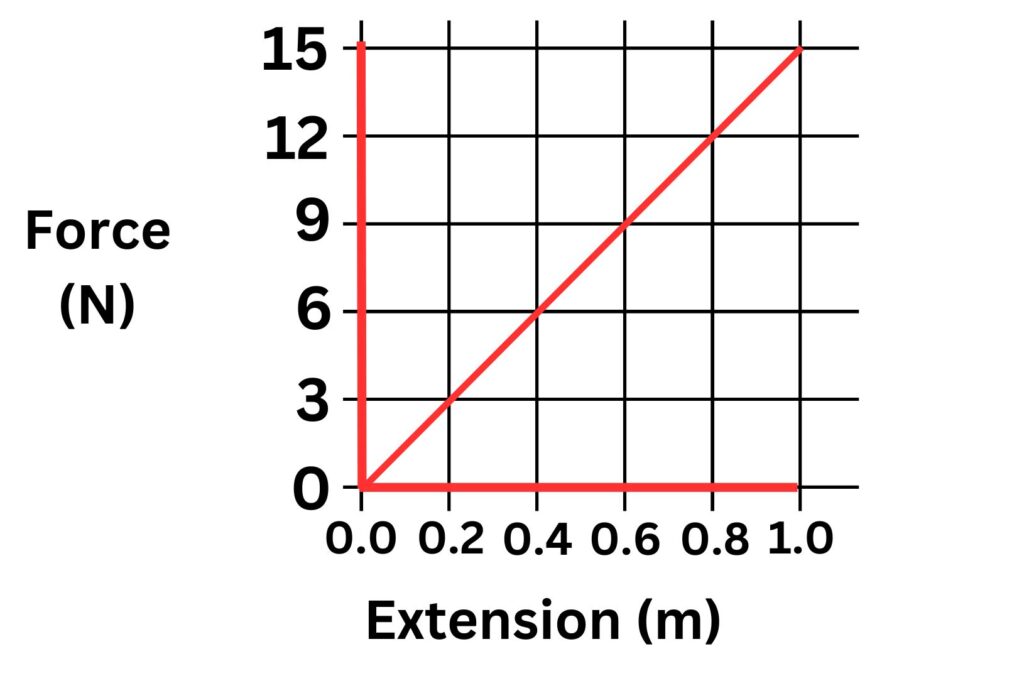
3. Using the graph below, calculate the spring constant

Absorption and Emission of EM Radiation
JJ Thomson and Plum pudding model
Ernest Rutherford and the Nuclear Model
Niels Bohr changing the Nuclear Model
Discovering the Proton and Neutron
Measuring radiation from radioactivity
Radiation types and properties
Random nature of radioactive decay
Radioactive contamination or irradiation
Hazards of contamination and irradiation
Studies on the effects of radiation on humans
Different half lives of radioactive isotopes
Nuclear Fission Chain Reaction
Writing nuclear fission equations
Drawing ray diagrams for a concave lens
Drawing Ray Diagram to produce a virtual image for a convex lens
Drawing ray diagram to produce a real image for a convex lens.
Specular and Diffuse Reflection
Seeing Coloured Objects Part 2
Viewing objects through coloured filters
Transparent, Translucent and Opaque