AQA GCSE The effect of a factor on human reaction time (Biology)
The effect of a factor on human reaction time
Reaction time is the time taken for a person to respond to a stimulus.
It involves:
1. Receptors detecting a stimulus
2.Sensory neurones carrying impulses to the CNS
3.Processing in the brain or spinal cord
4.Motor neurones carrying impulses to effectors
Reaction time can be affected by factors such as:
Age
Fatigue
Practice
Distractions
Caffeine
Aim:
To investigate the effect of [chosen factor] on human reaction time.
(Example: age, number of practice attempts, level of distraction)
Variables
Independent variable: the factor changed (e.g. age group)
Dependent variable: reaction time (measured in seconds)
Control variables:
Same ruler
Same person dropping the ruler
Same hand used
Same posture and environment
Equipment
Ruler (30 cm, marked in mm)
Chair
Data recording sheet
Calculator
Risk Assessment
| Hazard | Risk | Control measure |
|---|---|---|
| Dropping ruler | Minor injury | Sit down, clear area |
| Repetitive testing | Fatigue | Rest between trials |
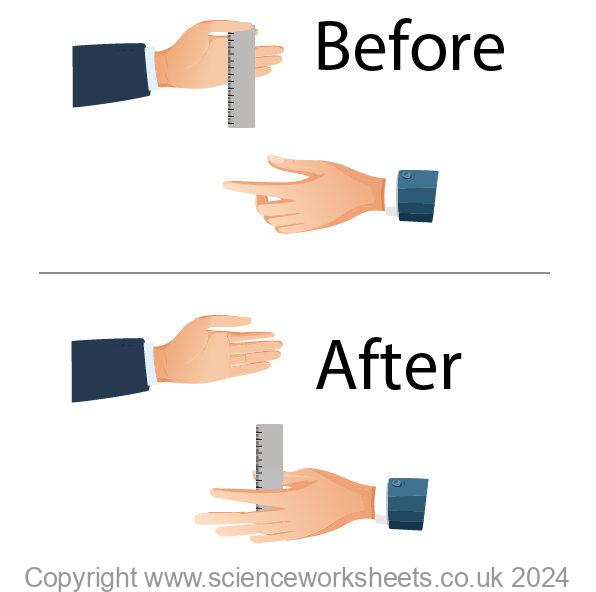
Method (Ruler Drop Test – Caffeine Investigation)
1.The participant sits with their arm resting on a table, hand open over the edge.
2.The ruler is held vertically with the 0 cm mark level with the participant’s thumb.
3.Without warning, the ruler is released.
4.The participant catches the ruler as quickly as possible.
5.Record the distance fallen.
6.Repeat three times and calculate a mean (no caffeine condition).
7.Steps 1–6 were repeated for participants from different age groups.
8.Wait a fixed time period (e.g. 10 minutes).
9.Repeat steps 2–6.
Below is a data set for the distance the ruler travelled before being caught and the calculated reaction time.
| Measurement | Age 13-14 | Age 15-16 | Age 17-18 |
|---|---|---|---|
| Trial 1 distance (cm) | 21.4 | 18.9 | 16.8 |
| Trial 2 distance (cm) | 19.8 | 17.6 | 15.9 |
| Trial 3 distance (cm) | 20.6 | 18.2 | 16.3 |
| Mean distance (cm) | 20.6 | 18.2 | 16.3 |
| Reaction time (s) | 0.20 | 0.19 | 0.18 |
Anomalous data
Any anomalous values should NOT be included in the mean calculation.
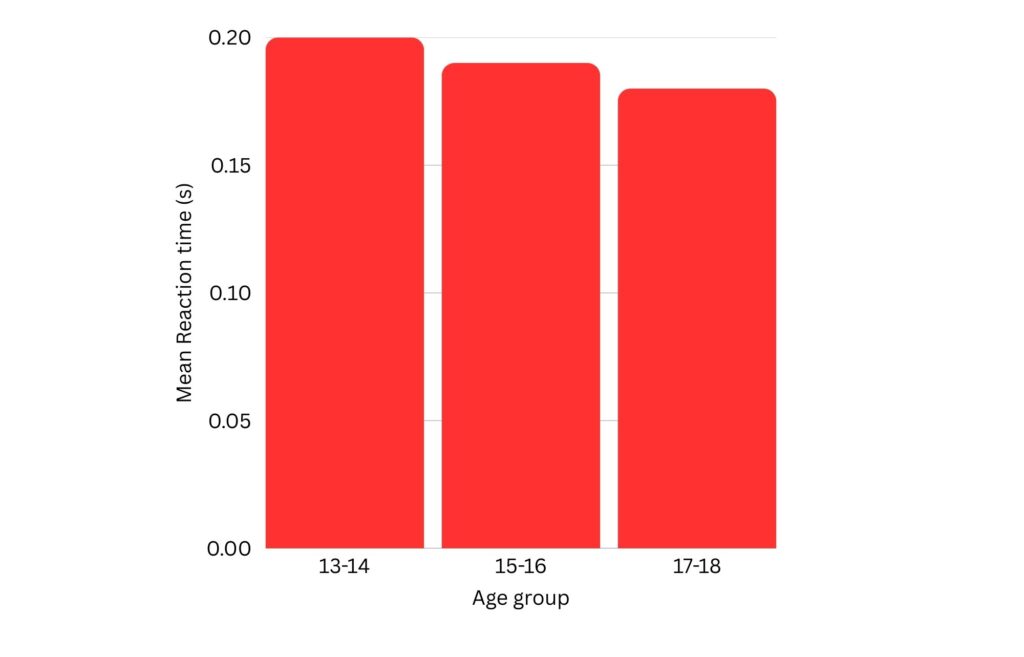
Below is a graph of reaction time (Y axis) against age group (x axis).
Conclusion
You do not need to learn a specific conclusion, but this section is designed to help you develop certain skills.
A good scientific conclusion should do four key things:
1.Start by directly answering the question the investigation set out to investigate.
Refer to the independent variable
Refer to the dependent variable
State the overall trend
2.Refer to the data:
Quote mean values
Use comparisons (highest vs lowest, fastest vs slowest)
3.Use scientific reasoning
Explain why the trend happened using science, not opinions.
Link to biology/chemistry/physics content
Use correct terminology
4.Stay in the conclusion lane
Do not include:
Errors
Improvements
Reliability
Fair test comments
Those belong in evaluation, not conclusions.
Below is an example of a conclusion.
The results show that reaction time decreases as age increases. The youngest age group (13–14 years) had the largest mean ruler drop distance (20.6 cm), corresponding to the slowest mean reaction time (0.20 s). In contrast, the oldest age group (17–18 years) had the smallest mean distance (16.3 cm) and the fastest reaction time (0.18 s).
This suggests that older participants responded more quickly to the stimulus than younger participants. This may be because nerve pathways are more developed and signals are transmitted and processed more quickly in older individuals.
Overall, the data supports the conclusion that age affects human reaction time, with reaction time generally improving as age increases.
Evaluation
You do not need to learn a specific evaluation, but this section is designed to help you develop certain skills.
You should comment on:
Reliability (repeats, averages)
Accuracy (human error, ruler alignment)
Validity (control of variables)
Improvements (more participants, automated timing)
Below is an example of a sample evaluation
The investigation produced repeatable results because three trials were taken for each age group and a mean was calculated. This reduces the effect of random error and increases reliability. However, only one participant was tested in each age group, which limits reliability because results may not represent the wider population.
The accuracy of the results may have been affected by human error. For example, the ruler may not have been released without warning each time, and participants may have anticipated the drop. In addition, measuring the exact point where the ruler was caught can be difficult, leading to small measurement errors.
The investigation had some limitations in validity. Although age was the independent variable, other factors such as tiredness, prior caffeine intake, and level of concentration may not have been fully controlled. This means that changes in reaction time may not be due to age alone.
The investigation could be improved by testing a larger number of participants in each age group and calculating a mean for each group. Using electronic timing equipment instead of a ruler would also improve accuracy by reducing human reaction and measurement errors.
Factors affecting the rate of photosynthesis
Measuring & calculating rates of photosynthesis
Inverse square law and photosynthesis
Economics of enhancing the conditions in greenhouses
Investigating the effect of light intensity on the rate of photosynthesis
Data analysis and nervous system
The effect of a factor on human reaction time
Controlling blood glucose concentration
Regulating water and nitrogen levels in the body.
Hormones and human reproduction
Using hormones to treat infertility
Control and coordination in plants using hormones
Investigating the effect of light or gravity on the growth of newly germinated seedlings