AQA GCSE Velocity time graphs calculating acceleration (Combined Science)
Practice Questions
1. Given two points on a velocity-time graph, how would you calculate the slope to find acceleration?
For a straight line graph, form a triangle. Measure the change in velocity and the change in time.
Then use the formula
acceleration = change in velocity/time
For a curved line graph, draw a tangent line to the curve where you want to measure the gradient. Use the tangent line to form a triangle. Measure the change in velocity and time.
Calculate acceleration by dividing the change in velocity by time period.
2. What does a curved line on a velocity-time graph indicate about acceleration?
Gradient is changing, so the acceleration is changing.
3. Use the following data to draw a velocity time graph and then calculate the acceleration.
| Velocity (m/s) | Time (s) |
|---|---|
| 0 | 0 |
| 20 | 1 |
| 40 | 2 |
| 60 | 3 |
| 80 | 4 |

Change in velocity = 40m/s
Time period 2 seconds
Acceleration = Change in velocity/time
Acceleration = 40/2 = 20m/s2
4. Use the following data to draw a velocity time graph and then calculate the gradient at 4.5 seconds.
| Velocity (m/s) | Time (s) |
|---|---|
| 0 | 0 |
| 4 | 1 |
| 10 | 2 |
| 25 | 3 |
| 75 | 4 |
| 150 | 5 |
| 400 | 6 |
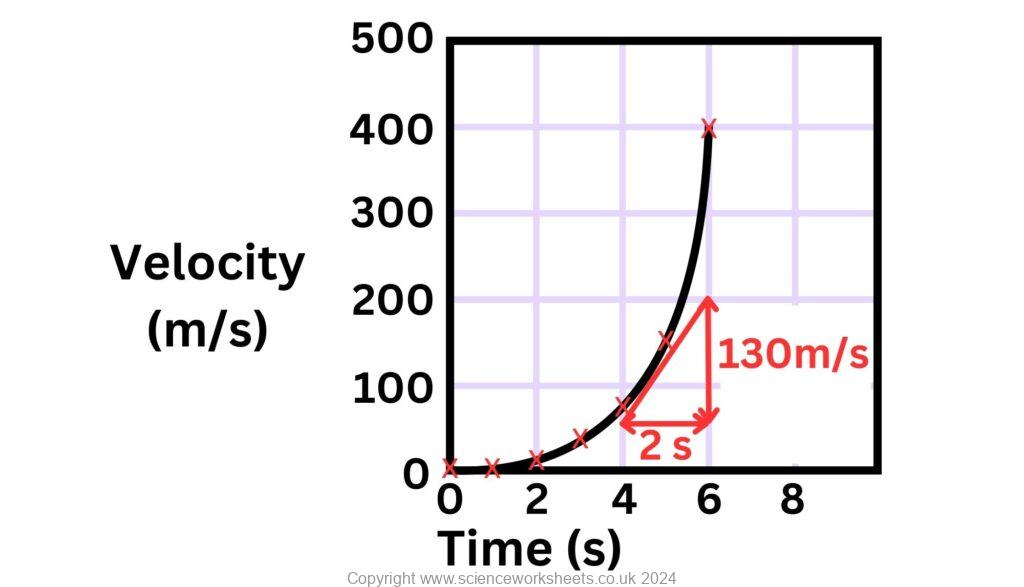
Change in velocity = 200-70 = 130m/s
Time period = 2 seconds
Acceleration = change in velocity/time
Acceleration = 130/2 = 65m/s2
Absorption and Emission of EM Radiation
JJ Thomson and Plum pudding model
Ernest Rutherford and the Nuclear Model
Niels Bohr changing the Nuclear Model
Discovering the Proton and Neutron
Measuring radiation from radioactivity
Radiation types and properties
Random nature of radioactive decay
Radioactive contamination or irradiation
Hazards of contamination and irradiation
Studies on the effects of radiation on humans