Answers to AQA GCSE Half Life (Combined Science)
Practice Questions
1.Using the graph below estimate the half life for the sample.
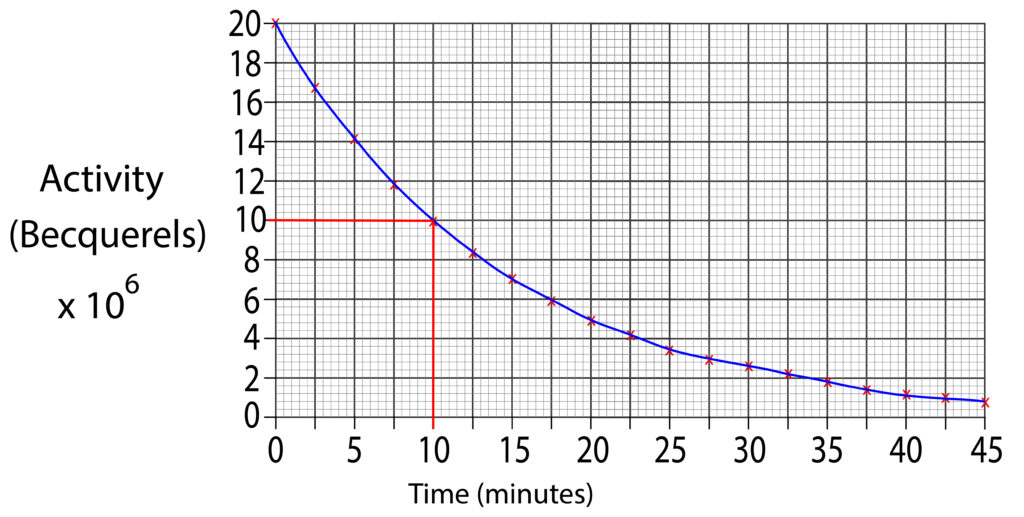
In this case the half life is 10 minutes
2. Using the graph below estimate the half life for the sample
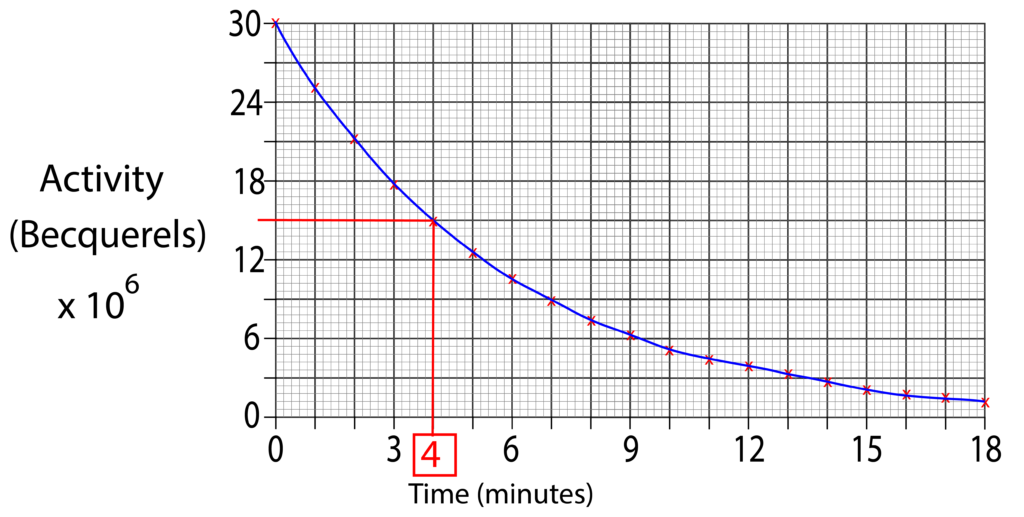
In this case the half life is 4 minutes
3. Use the data in the table below to plot your own graph and calculate the half life.
| Time (seconds) | Activity (counts per second) |
|---|---|
| 0 | 241 |
| 30 | 212 |
| 60 | 188 |
| 90 | 165 |
| 120 | 145 |
| 150 | 127 |
| 180 | 112 |
| 210 | 99 |
| 240 | 87 |
| 270 | 76 |
| 300 | 67 |
| 330 | 59 |

Half life is 159 seconds, two half lives have been drawn on this graph.
Absorption and Emission of EM Radiation
JJ Thomson and Plum pudding model
Ernest Rutherford and the Nuclear Model
Niels Bohr changing the Nuclear Model
Discovering the Proton and Neutron
Measuring radiation from radioactivity
Radiation types and properties
Random nature of radioactive decay
Radioactive contamination or irradiation
Hazards of contamination and irradiation
Studies on the effects of radiation on humans