AQA GCSE Data analysis and nervous system (Biology)
Data analysis and nervous system
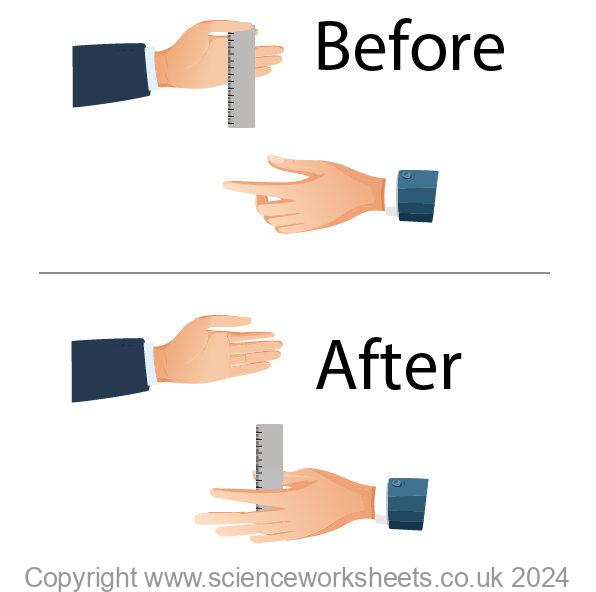
The ruler drop test can be used to measure reaction times.
Reaction time = time taken to respond to a stimulus
Measured in milliseconds (ms)
Factors affecting reaction time:
Age
Practice
Drugs (alcohol, caffeine)
Fatigue
Distractions
or seconds (s)
Below is an image showing the ruler drop test.
Below is a data set for the distance the ruler travelled before being caught and the calculated reaction time.
| Age (years) | Distance ruler dropped (cm) | Reaction time (s) |
|---|---|---|
| 10 | 21 | 0.21 |
| 12 | 19 | 0.20 |
| 14 | 23 | 0.22 |
| 16 | 16 | 0.18 |
| 18 | 15 | 0.17 |
| 20 | 14 | 0.17 |
| 25 | 16 | 0.18 |
| 40 | 18 | 0.19 |
| 50 | 21 | 0.21 |
| 60 | 22 | 0.22 |
| 70 | 25 | 0.23 |
| 80 | 26 | 0.23 |
Anomalous data
There are two anomalous data points in the table above, these have been highlighted in red.
Any anomalous values should NOT be included in the mean calculation and do not form part of the line of best fit for the graph.
Below is a graph of reaction time (Y axis) against age (x axis).

Converting numerical data into graphical data
Step 1: Identify variables
In this case:
Independent variable → x-axis (e.g. age)
Dependent variable → y-axis (reaction time)
Step 2: Choose the correct graph type
| Data type | Graph type |
|---|---|
| Continuous data (age, time) | Line graph |
| Categories (before/after) | Bar chart |
| Two continuous variables | Scatter graph |
Step 3: Choose a sensible scale
Use most of the graph paper
Use simple intervals (1, 2, 5, 10)
Start at 0 unless there’s a good reason
Step 4: Label axes correctly
Must include:
Variable name
Unit in bracketse.g Reaction time (seconds)
Step 5: Plot accurately
Plot with a small cross
Read values carefully
Step 6: Line of best fit
Smooth curve or straight line
Not dot-to-dot
Anomalies should not control the line
Practice Questions
1.Using the data table above to answer the following questions:
1a.State the name of the independent variable
1b. State the name of the dependent variable
1c. State the units of reaction time in the data table or graph
2. What was the reaction time of a 20-year-old?
3.Which participant had the fastest reaction time?
4.Estimate the reaction time at age 45
5. Describe the trend shown
Factors affecting the rate of photosynthesis
Measuring & calculating rates of photosynthesis
Inverse square law and photosynthesis
Economics of enhancing the conditions in greenhouses
Investigating the effect of light intensity on the rate of photosynthesis
Data analysis and nervous system
The effect of a factor on human reaction time
Controlling blood glucose concentration
Regulating water and nitrogen levels in the body.
Hormones and human reproduction
Using hormones to treat infertility
Control and coordination in plants using hormones
Investigating the effect of light or gravity on the growth of newly germinated seedlings