AQA GCSE Investigating Transpiration (Biology)
Investigating Transpiration
Transpiration is defined as the loss of water vapour from the leaves of the plant, through the open stomata
A potometer measures the rate of water uptake by a shoot.
A potometer does not measure water loss from a shoot.
However, it’s assumed that the rate of water uptake is almost equal to the rate of water loss by transpiration, because most of the water taken up is lost through the leaves. Some of the water taken in by a plant is used for photosynthesis and some is used to keep the cells turgid.
A Potometer
This is how a potometer is used:
1. Prepare the potometer: fill with water and remove all air bubbles.
2. Submerge the shoot in water and cut a fresh 2–3 cm off the stem UNDERWATER (prevents air entering xylem). The stem should be cut at a slant to increase surface area.
3. Immediately attach the shoot to the potometer (underwater or in a water film) and seal with rubber tubing/grease so the connection is airtight.
4.Place the potometer vertically in a clamp. Introduce a single air bubble into the capillary tube (if using a bubble potometer). This is done by lifting the capillary tube out of the beaker of water for 1 second, then placing it back into the water. Record the bubble’s starting position in mm.
5. Set up your environmental condition such as a fan for air movement, which blows onto the leaves. See the table below the diagram on how to vary different environmental conditions.
6. Now start the stopwatch and after 60 minutes stop the stopwatch. At the end of the 60 minutes record the position of the bubble in mm
7.Do at least three repeats with different shoots.
8.Between repeats, reset the bubble to a known starting position, this is achieved by opening the reservoir tap.

Changing the environmental conditions (independent variable)
We need to be able to change the environmental conditions that the shoot is exposed to, so we can see how this affects transpiration.
Below is a table which shows how you can adjust environmental conditions for transpiration experiments.
| Environmental condition (independent variable) | How to change condition |
|---|---|
| Light intensity | Lamp at different distances from the shoot |
| Air movement | Fan at either different settings (low, medium or high). Alternatively, same power setting of fan, but moved different distances from the shoot. |
| Humidity | To increase humidity place the shoot and potometer inside a plastic bag or bell jar with some damp cotton wool or tissue inside. This increases water vapour in the air around the leaves. To decrease humidity use a dehumidifer. |
| Temperature | To increase temperature use a heater. To decrease temperature carry out the experiment in a cooler room. |
Calculating the rate of transpiration.
You can calculate the rate of transpiration using the following formula.
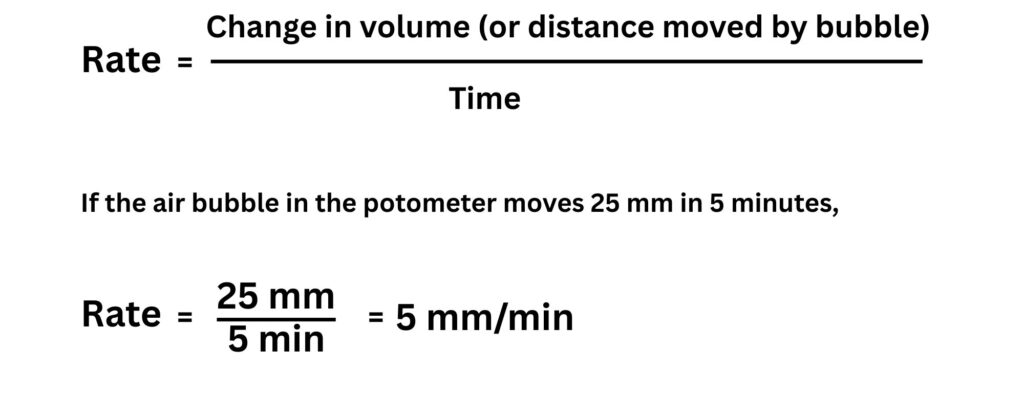
Sometimes you’ll convert to:
mm/s, cm³/min, or mm³/s, depending on your data.
Plotting and drawing graphs
Independent variable (what you change): on the x-axis
→ e.g. light intensity, temperature, humidity, or air movement
Dependent variable (what you measure): on the y-axis
→ e.g. rate of transpiration (mm/min)
Tips:
Use a line graph (not a bar chart) when both variables are continuous.
In GCSE science, continuous data means: Data that can take any numerical value within a range.
Choose appropriate, evenly spaced scales.
Label axes clearly with units, e.g. “Light intensity (arbitrary units)” and “Rate of transpiration (mm/min)”
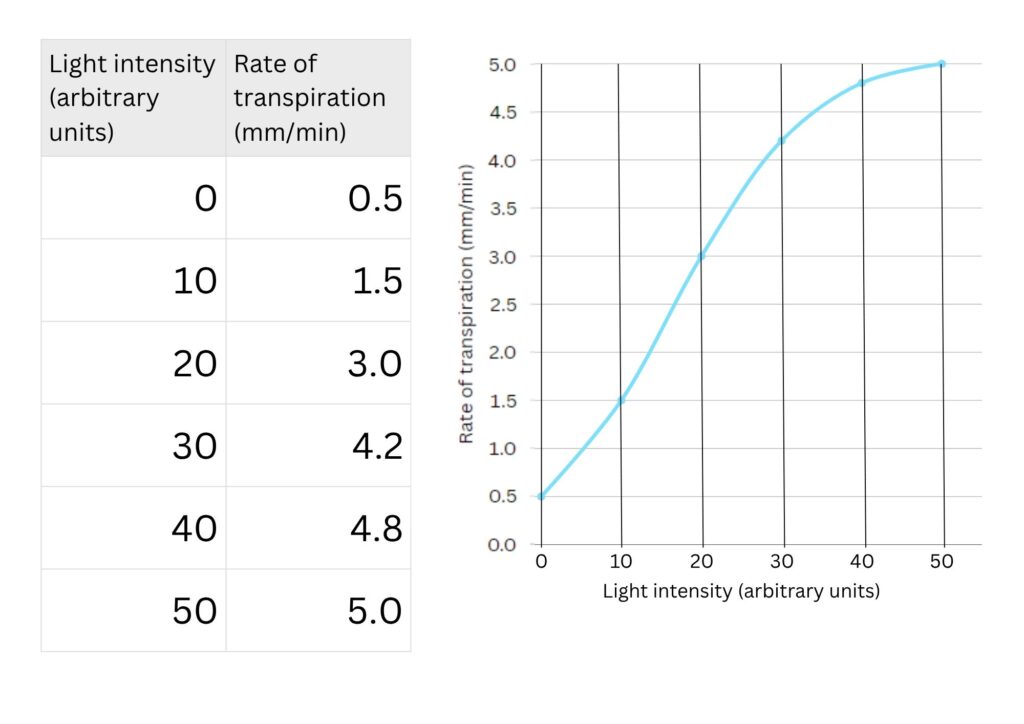
Below is a set of sample data for a transpiration experiment, where light intensity was the limiting factor.
| Light intensity (arbitrary units) | Rate of transpiration (mm/min) |
|---|---|
| 0 | 0.5 |
| 10 | 1.5 |
| 20 | 3.0 |
| 30 | 4.2 |
| 40 | 4.8 |
| 50 | 5.0 |
Translating between graphs and numerical data
You should be able to:
Read off values from a graph (e.g. rate of transpiration at a specific light intensity).
-Use a ruler to read the data, so you do not misread the data points. Draw a line from one axis to the graph line, then draw another line from the graph line to the other axis.
Estimate values between data points (interpolation).
Using the graph above, at light intensity of 15, the rate of transpiration is approx 2.2 mm/min.
Spot trends and patterns (e.g. “As temperature increases, rate of transpiration also increases”).
Using the graph above, as light intensity increases, so does the rate of transpiration.
Identify when a trend levels off (e.g. light saturation point).
The light saturation point is the light intensity beyond which an increase in light no longer increases the rate of transpiration. Using the graph above at 50 light intensity units it is approaching the light saturation point. However, it is not quite there yet. The line would have to be horizontal.
Extracting and interpreting data from tables
Given a results table like:
| Light intensity (arbitrary units) | Distance bubble moved (mm) | Time (min) | Rate (mm/min) |
|---|---|---|---|
| 10 | 8 | 4 | 2 |
| 20 | 12 | 4 | 3 |
| 30 | 20 | 4 | 5 |
| 40 | 24 | 4 | 6 |
You should be able to:
1.Calculate missing rates using
Rate = distance/time
2.Spot anomalies, such as the distance moved for 20 light intensity units. It seems too low compared to other data points.
3. Describe the pattern → “Rate of transpiration increases with light intensity, but levels off at higher intensities.”
Practice Questions
1.Define the term transpiration
2. State what a potometer measures
3. During the set up of a potometer, the shoot is cut underwater. Explain why
4. Name 4 conditions which affect the rate of transpiration
Factors affecting the rate of photosynthesis
Measuring & calculating rates of photosynthesis
Inverse square law and photosynthesis
Economics of enhancing the conditions in greenhouses
Investigating the effect of light intensity on the rate of photosynthesis
Data analysis and nervous system
The effect of a factor on human reaction time
Controlling blood glucose concentration
Regulating water and nitrogen levels in the body.
Hormones and human reproduction
Using hormones to treat infertility
Control and coordination in plants using hormones
Investigating the effect of light or gravity on the growth of newly germinated seedlings